

![[Fixed] Latest Fitbit app update broke Benchmark range on Android & iOS, issue under investigation](https://techissuestoday.com/wp-content/uploads/2024/04/fitbit-sleep-graph-benchmark-missing.webp "[Fixed] Latest Fitbit app update broke Benchmark range on Android & iOS, issue under investigation")
Update 03/05/24 1:03 pm (IST): Fitbit has begun rolling out a new version of the Fitbit app that addresses the missing Benchmark range in the sleep graph. According to a Fitbit mod, version 4.16 is rolling out gradually and will be available to all users shortly.
I want to let you know that the new Fitbit app 4.16 version has started to slowly roll-out to all our members. This update brings a fix for this issue, so please make sure to install it once you see it available. Keep in mind that the sleep benchmark will only appear for logs that contain sleep stages. (Source)
Original article published on April 25, 2024 follows:
Fitbit seems to be in hot waters with all its recent changes. Earlier, I reported on the massive backlash from users concerning the new Fitbit app UI. Now, it appears a bug has managed to slip through the internal tests and has left many users frustrated. According to reports flooding the Fitbit community, users can no longer see their Benchmark ranges. Here’s how affected users describe the situation:
Sleep data is recording ok, my sleep stages are recorded, my sleep data shows up on app and can compare to 30 days average with black dots to indicate averages but when Benchmark is chosen only my last sleep stages night data is shown in a line graph BUT no shaded area is apparent indicating averages for others in my age group. (Source)
Anyone else missing sleep comparison data under the Benchmark tab? My data is shown but no “Typical range for people like you” (Source)
Why did @fitbit @FitbitSupport take the recommemded percentages off the benchmark display in sleep stats? (Source)
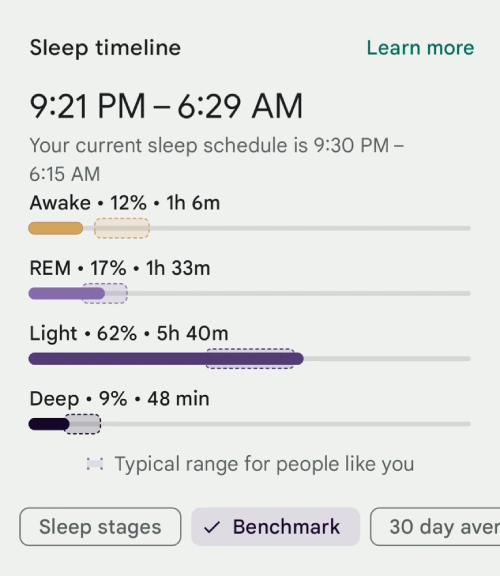
If you’re not familiar with what’s going on, this might seem a bit confusing. So let me break it down. The new UI shows the “Typical range” in a highlighted rectangular shape over the graph. I’ve added a screenshot shared by a user on the official forums below for reference:
While this is working as expected for some users, several others aren’t as lucky. Many users are reporting that they cannot see the “Typical range”. Here’s how the graph appears when affected users select the “Benchmark” tab:
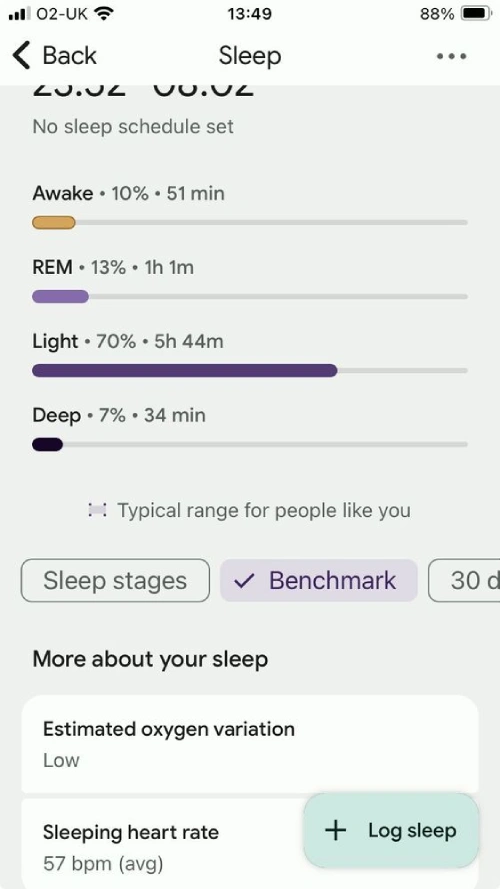
As you can see, the “Typical ranges” are not superimposed on the graph. This is the problem many users are facing. While it’s not what you might consider a “massive” issue, it does ruin the user experience slightly. It’s also worth noting that the bug affects users with Android and iOS devices. Not being able to compare your data with the typical average means, you’ll just have to assess the data manually.
Luckily, Fitbit is aware of the problem and a fix is now in the works. This message has been conveyed to users in multiple threads in the community.
I’d like to inform you that the issue with the benchmark tab not showing the shaded area has been escalated to our team, and they’ll work to get it fixed. (Source)
There’s no ETA for a fix, but granted the issue was acknowledged several days ago, I’d expect to see a fix go live anytime now. So keep your eyes peeled for an update on the App Store or Play Store. There’s currently no “workaround” to fix the problem. So waiting for an update is the only means right now. That said, I hope this article helped you understand what’s going on with the bugged Benchmark tab in the latest Fitbit app. That’s it from my side.
TechIssuesToday primarily focuses on publishing 'breaking' or 'exclusive' tech news. This means, we are usually the first news website on the whole Internet to highlight the topics we cover daily. So far, our stories have been picked up by many mainstream technology publications like The Verge, Macrumors, Forbes, etc. To know more, head here.


Himanshu Arora
295 Posts
I have been writing tech-focused articles since 2010. In my around 15 years of experience so far, I have written for many leading publications, including Computerworld, GSMArena, TechSpot, HowtoForge, LinuxJournal, and MakeTechEasier to name a few. I also co-founded PiunikaWeb, which went on to become a huge success within 5 years of its inception. Here at TechIssuesToday, I aim to offer you helpful information in a way that you won't find anywhere else easily.


Himanshu Arora 29-04-2024
You are welcome Dp.
Dp28-04-2024
Thanks!
Reply